
The Metro Vancouver housing market continued its slow pace in May 2025, as rising inventory levels failed to translate into increased sales activity. According to the latest data from the Greater Vancouver REALTORS® (GVR), home sales were notably subdued while available listings surged to a ten-year high.
Sales Slump Despite Seasonal Trends
A total of 2,228 residential properties were sold in Metro Vancouver in May, marking an 18.5% drop compared to the 2,733 sales recorded in May 2024. Even more striking, this figure sits 30.5% below the region’s 10-year seasonal average of 3,206.
“While we’re starting to see some signs that activity might be picking up, sales still lag historical norms,” said Andrew Lis, GVR’s director of economics and data analytics. “Year-to-date, 2025 sales are among the slowest we’ve seen in the past decade—comparable only to the sluggish starts of 2019 and 2020.”
Lis noted that while the second half of 2020 saw a sharp rebound in market activity, it remains to be seen whether 2025 will follow a similar trajectory.
Inventory Surges, Market Tilts Toward Buyers
May saw 6,620 new listings hit the market—up 3.9% year-over-year and 9.3% above the 10-year average. Total active listings reached 17,094, a 25.7% increase from the 13,600 available in May 2024 and nearly 46% above the decade average.
This growing inventory is starting to impact pricing dynamics. The sales-to-active listings ratio—a key metric for gauging market balance—was 13.4% overall in May. Broken down by property type, the ratio was:
10.2% for detached homes
17.4% for townhomes
14.7% for condos
Historically, sustained ratios below 12% suggest downward pressure on prices, while ratios above 20% tend to push prices up. With current levels hovering in the neutral-to-buyer’s-market range, price stability—or even softness—remains likely.
“With inventory at some of the healthiest levels we’ve seen in years, sellers are adjusting their expectations,” Lis explained. “Buyers now have more negotiating room, and price growth has remained in check.”
Price Trends: Modest Declines Across the Board
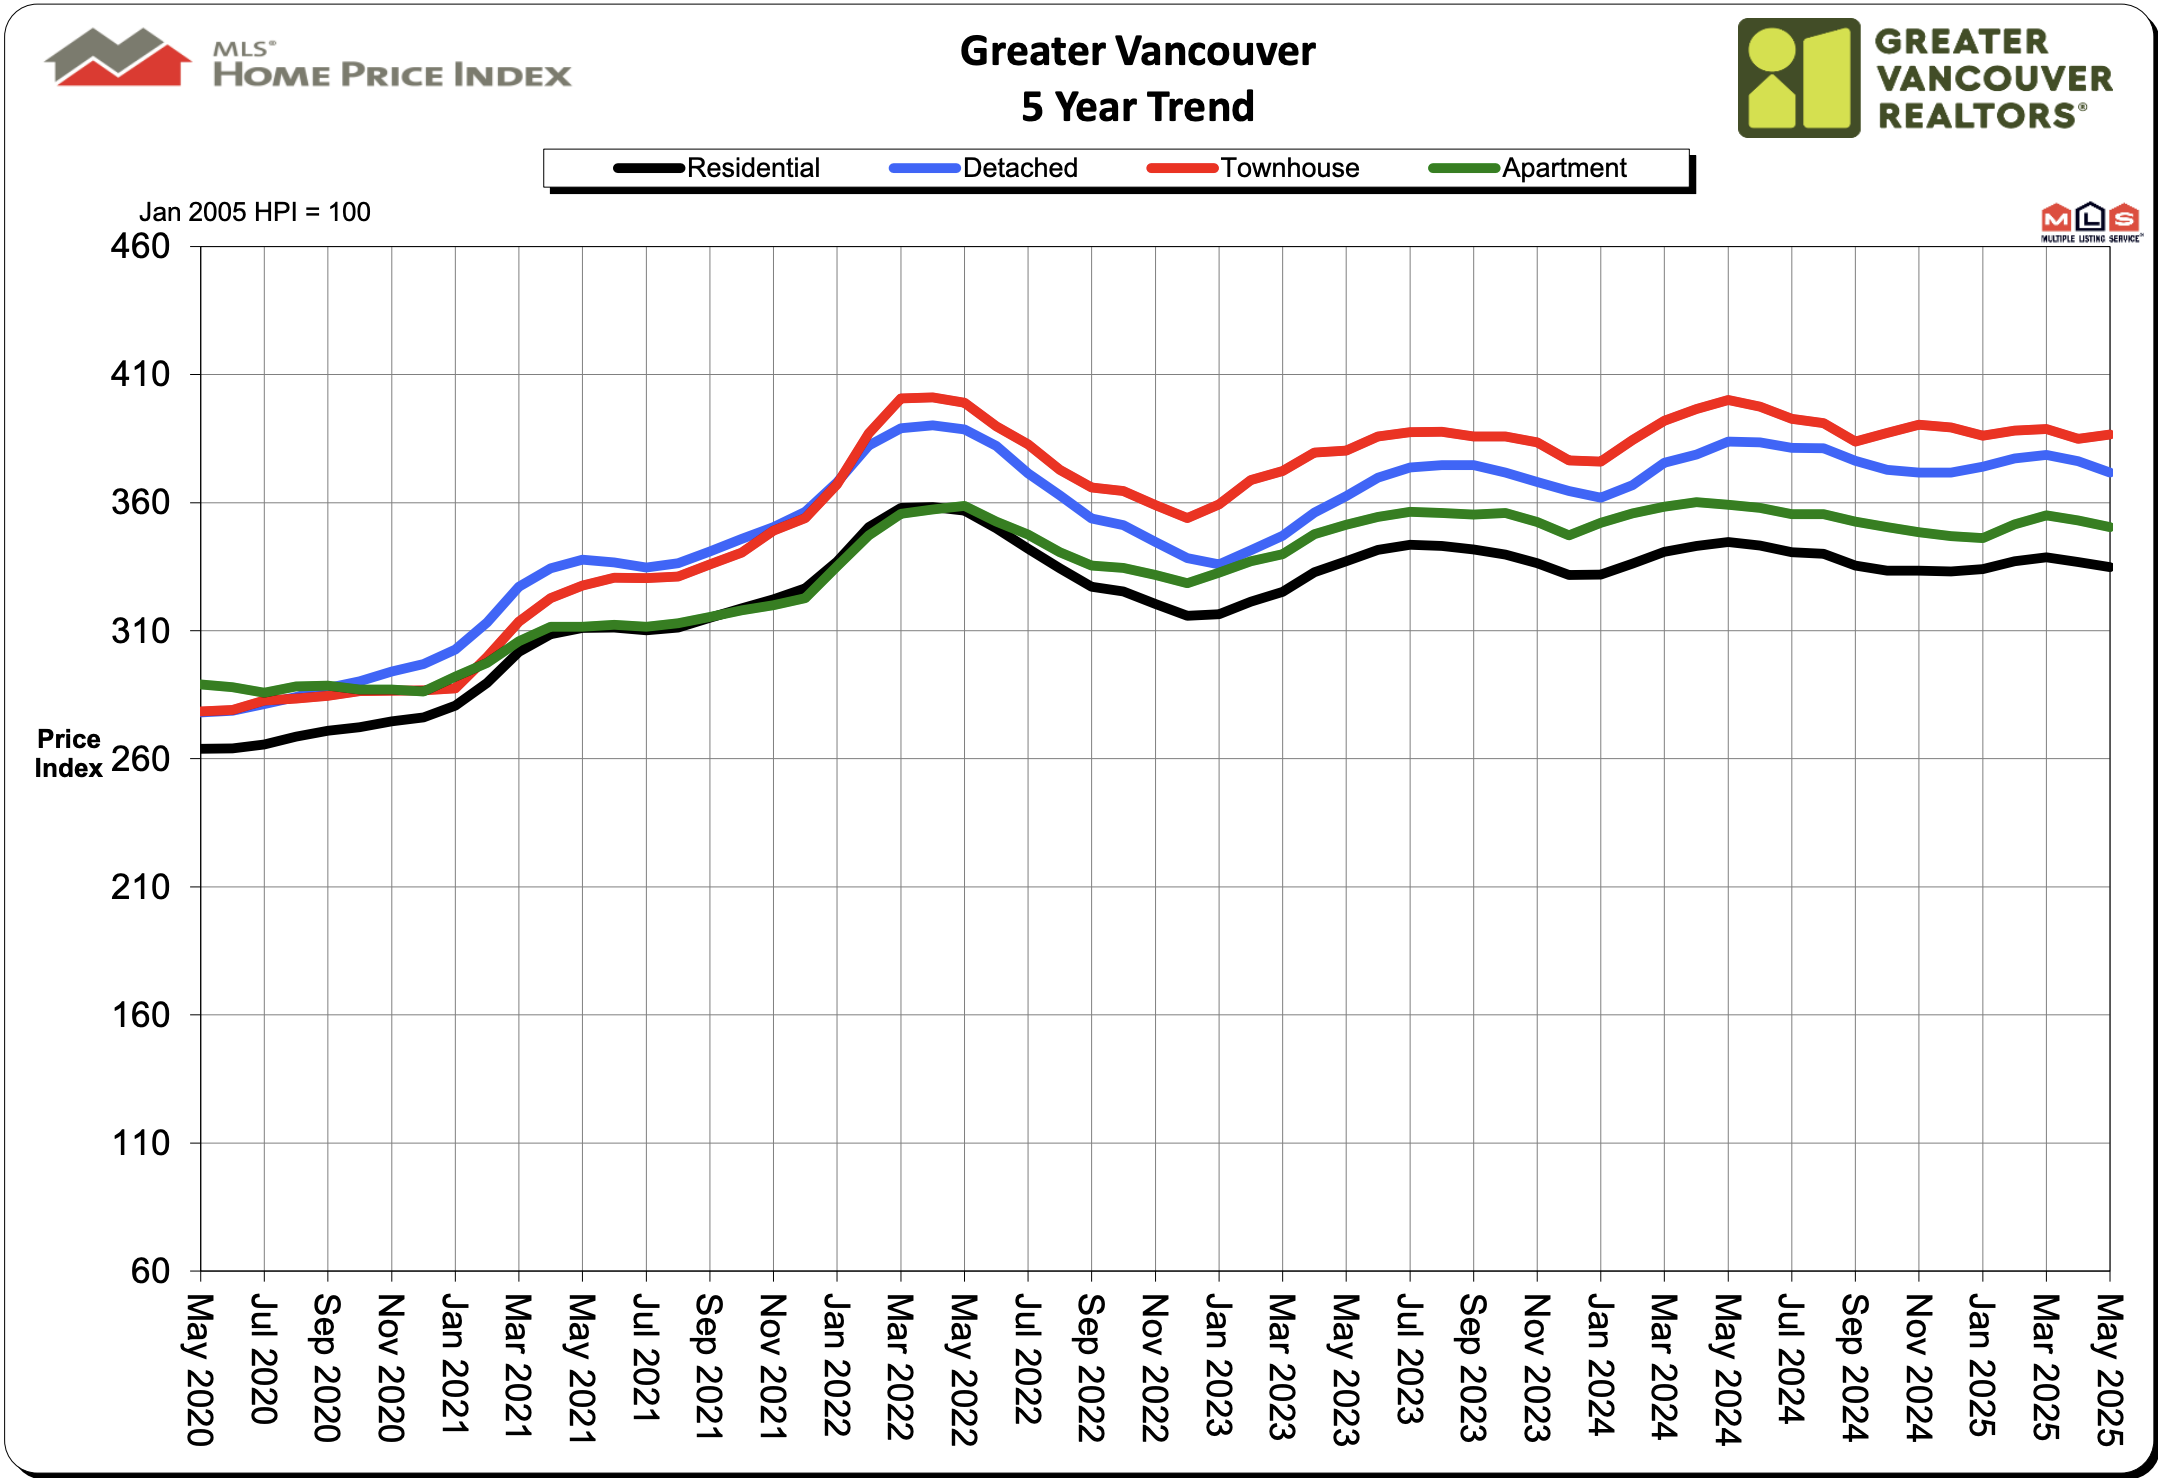
The MLS® Home Price Index composite benchmark price for all residential properties in Metro Vancouver now sits at $1,177,100, representing a 2.9% decline from May 2024 and a 0.6% decrease compared to April 2025.
By property type:
Detached homes: 654 sales (-22.7% YoY), benchmark price $1,997,400 (-3.2% YoY, -1.2% MoM)
Apartments: 1,087 sales (-18.8% YoY), benchmark price $757,300 (-2.4% YoY, -0.7% MoM)
Townhomes: 469 sales (-10.3% YoY), benchmark price $1,106,800 (-3.4% YoY, +0.4% MoM)
Outlook: A Buyer-Friendly Summer?
As we move into the typically quieter summer season, there’s speculation that pent-up demand could fuel increased activity, particularly if buyers who delayed decisions in spring begin to enter the market.
“With such a sluggish spring, we could see an unusually active summer,” said Lis. “For now, the market continues to lean in favour of buyers—good news for those looking to make a move.”
Click here for the GVR May 2025 MLS Housing Market Report
Source: Greater Vancouver REALTORS® – June 2025 Market Report
Note: Metro Vancouver includes areas from Whistler to Maple Ridge and down to the U.S. border. Areas covered by Greater Vancouver REALTORS® include: Bowen Island, Burnaby, Coquitlam, Maple Ridge, New Westminster, North Vancouver, Pitt Meadows, Port Coquitlam, Port Moody, Richmond, South Delta, Squamish, Sunshine Coast, Vancouver, West Vancouver, and Whistler.
Comments:
Post Your Comment: