
VANCOUVER - August 5, 2025 - Home sales registered on the MLS® across Metro Vancouver in July extended the early signs of recovery that emerged in June, now down just two per cent from July of last year.
The Greater Vancouver REALTORS® (GVR) reports that residential sales in the region totalled 2,286 in July 2025, a 2% decrease from the 2,333 sales recorded in July 2024. This was 13.9% below the 10-year seasonal average (2,656).
“The June data showed early signs of sales activity in the region turning a corner, and these latest figures for July are confirming this emerging trend,” said Andrew Lis, GVR’s director of economics and data analytics. “Although the Bank of Canada held the policy rate steady in July, this decision could help bolster sales activity by providing more certainty surrounding borrowing costs at a time where economic uncertainty lingers due to ongoing trade negotiations with the USA.”
In July 2025, there were 5,642 new listings for detached, attached, and apartment properties across Metro Vancouver—a 0.8% increase compared to July 2024. Still, new listings were 12.4% higher than the 10-year average for the month.
The total number of active listings reached 17,168, a 19.8% increase year-over-year, and 40.2% higher than the 10-year seasonal average. The number of active listings on the MLS System still far out weighs the number of active buyers leading properties to continue to sit on the market for extended periods of time.
The sales-to-active listings ratio across all property types in July was 13.8%, indicating balanced market conditions. By property type:
Detached homes: 10.2%
Attached homes (townhomes): 16.7%
Apartments: 15.9%
Analysis of the historical data suggests downward pressure on home prices occurs when the ratio dips below 12% for a sustained period, while home prices often experience upward pressure when it surpasses 20% over several months.
“With the rate of homes coming to market holding steady in July, the inventory of homes available for sale on the MLS® has stabilized at around 17,000. This level of inventory provides buyers plenty of selection to choose from,” Lis said. “Although sales activity is now recovering, this healthy level of inventory is sufficient to keep home prices trending sideways over the short term as supply and demand remain relatively balanced. However, if the recovery in sales activity accelerates, these favorable conditions for home buyers may begin slowly slipping away, as inventory levels decline, and home sellers gain more bargaining power.”
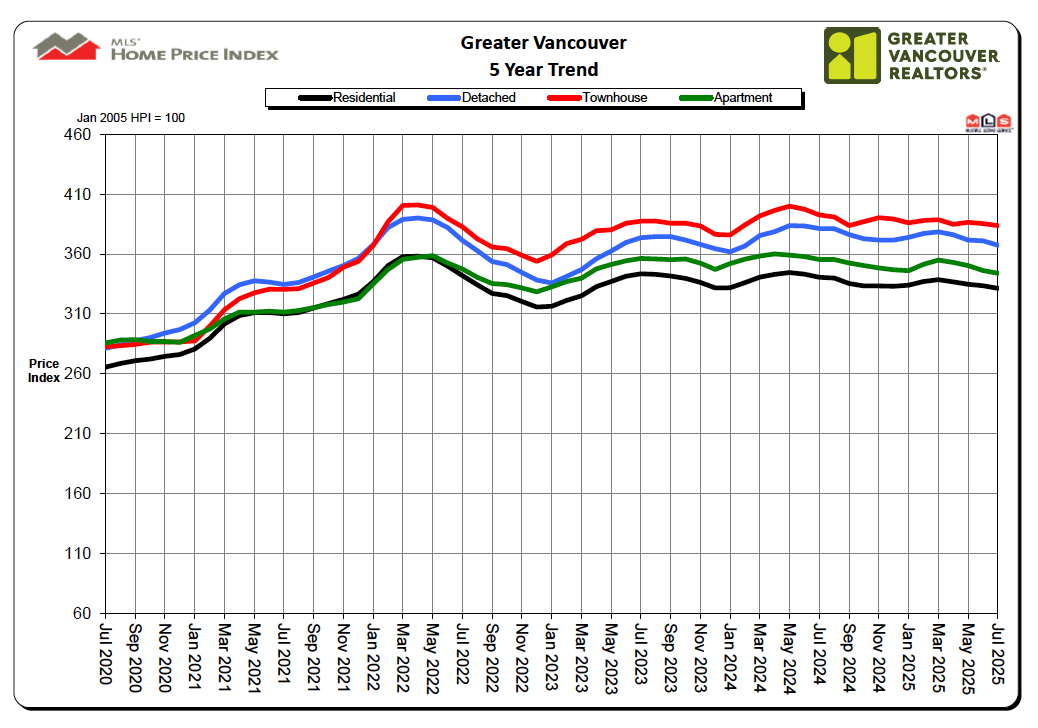
Home Prices and Sales Snapshot – July 2025
Composite Benchmark Price (All Residential): $1,165,500
↓ 2.7% from July 2024
↓ 0.7% from June 2025
Detached Homes:
Sales: 660 (↓ 4.1% Year over Year)
Benchmark Price: $1,974,400 (↓ 3.6% Year over Year | ↓ 1% Month over Month)
Apartments:
Sales: 1,158 (↓ 2.9% Year over Year)
Benchmark Price: $743,700 (↓ 3.2% Year over Year | ↓ 0.6% Month over Month)
Attached Homes (Townhomes):
Sales: 459 (↓ 5% Year over Year)
Benchmark Price: $1,099,200 (↓ 2.3% Year over Year | ↓ 0.4% Month over Month)
Comments:
Post Your Comment: