

Metro Vancouver home sales slowed again in August, bringing a quieter-than-usual summer market to a close.
A total of 1,869 residential properties sold through the MLS® in August 2026, according to Greater Vancouver REALTORS®. That was down 4.6% from the 1,959 sales recorded in August 2025 and 20.7% below the 10-year seasonal average of 2,356 sales.
Sales had performed largely as expected during the first four months of the year. Since May, however, activity has fallen behind GVR’s original forecast, and its economists now expect the slower pace to continue through the remainder of 2026.
There were 4,100 detached homes, townhouses, and apartments newly listed in August. That was 3% fewer than the 4,225 properties listed during the same month last year and 1.3% below the 10-year seasonal average.
At the end of August, 15,798 properties were available for sale across Metro Vancouver. Although that was 2.7% lower than August 2025, inventory remained 26.2% above the 10-year seasonal average.
The overall sales-to-active listings ratio was 12.3%. By property type, the ratio was 9.6% for detached homes, 15.1% for attached homes, and 13.7% for apartments.
Historically, prices often experience downward pressure when this ratio remains below 12% for an extended period. Upward pressure is more common when it stays above 20% for several months.
Inventory has gradually declined from the higher levels seen in 2025. However, sales have also remained slower than usual, resulting in prices continuing to move lower across all three property types.
Buyers currently have plenty of selection, softer prices, and relatively stable mortgage rates. Even so, many remain on the sidelines. GVR points to slower immigration, reduced investor demand, mortgage rates that are still not low enough to encourage stronger activity, and renewed trade uncertainty with the United States as factors affecting the market.
Metro Vancouver Benchmark Prices
The composite benchmark price for a residential property in Metro Vancouver was $1,081,900 in August. That was down 5.6% from August 2025 and 0.6% from July 2026.
Detached home sales totalled 557, down 3.1% from the 575 sales recorded last August. The detached benchmark price was $1,799,400, down 7.2% year over year and 1.3% from July.
Apartment sales declined 6.8%, with 891 homes selling compared with 956 in August 2025. The apartment benchmark price was $686,200, down 6.6% year over year and 0.3% month over month.
Townhouse sales were the only category to improve from last year. There were 412 sales, up slightly from 409 in August 2025. The townhouse benchmark price was $1,028,800, down 4.4% year over year and 0.2% from July.
Where Have Prices Held Up Best?
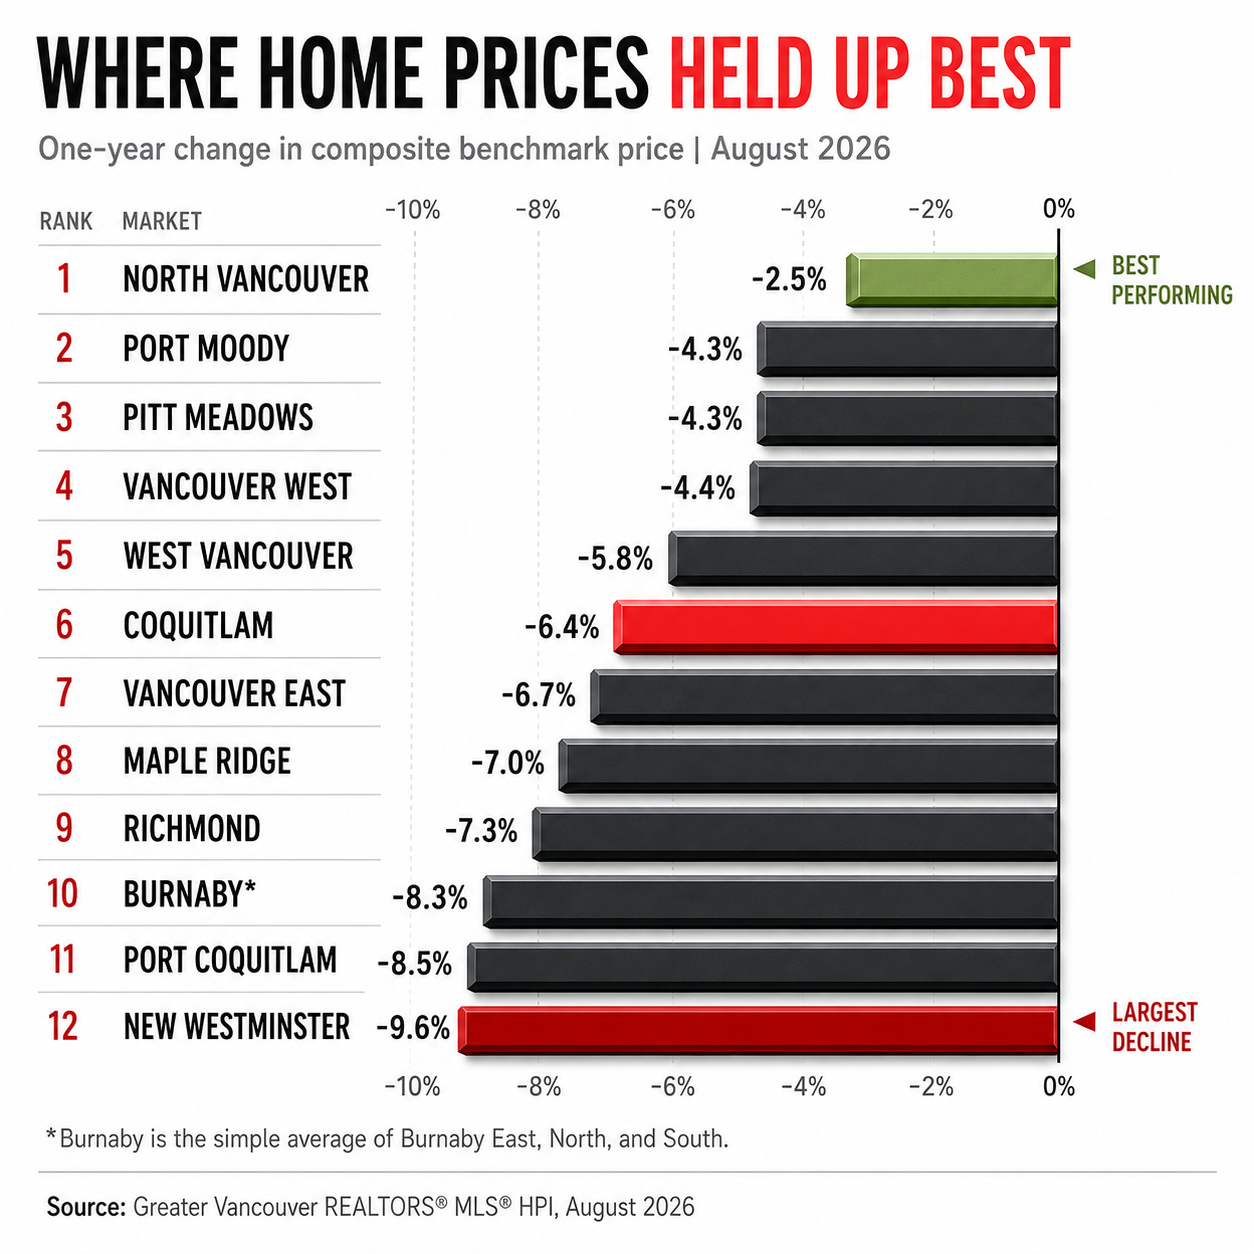
The accompanying graph compares the one-year change in composite benchmark prices across Vancouver and several surrounding cities. Prices were lower in every market shown, although some areas held up better than others.
North Vancouver recorded the smallest annual decline at 2.5%, followed by Port Moody and Pitt Meadows at 4.3%. New Westminster experienced the largest decline at 9.6%. Coquitlam was down 6.4%, while Burnaby’s three reported areas produced a simple average decline of approximately 8.3%.
These figures show how much market conditions can vary from one city to another. They can also vary significantly by neighbourhood, property type, price range, and even building.
Download the latest numbers here.
Statistics are from the Greater Vancouver REALTORS® August 2026 MLS® Housing Market Report. Benchmark prices represent the estimated value of a typical property and are not the same as average sale prices.

 The data relating to real estate on this website comes in part from the MLS® Reciprocity program of either the Greater Vancouver REALTORS® (GVR), the Fraser Valley Real Estate Board (FVREB) or the Chilliwack and District Real Estate Board (CADREB). Real estate listings held by participating real estate firms are marked with the MLS® logo and detailed information about the listing includes the name of the listing agent. This representation is based in whole or part on data generated by either the GVR, the FVREB or the CADREB which assumes no responsibility for its accuracy. The materials contained on this page may not be reproduced without the express written consent of either the GVR, the FVREB or the CADREB.
Comments:
Post Your Comment: